Ryan Stec
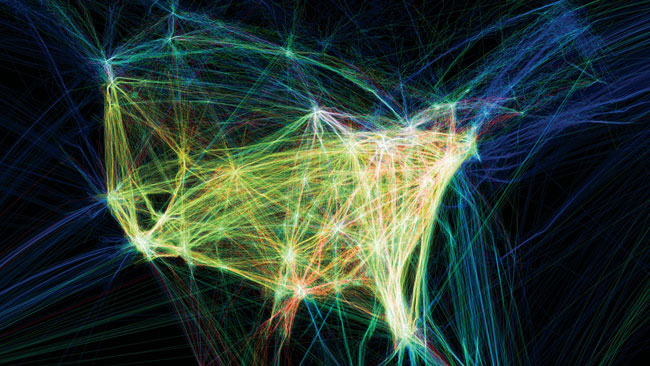
Aaron Koblin, Flight Patterns , 2005-2009. Image courtesy of the artist.
Introduction
Most digital and electronic technologies are not singular things, but rather complex and sophisticated combinations of other technologies. This is the case for mobile phones and the map applications people use to find their way through cities. The device itself is a layering of hundreds of specific technologies, each with its own history, legal protections and diverse implementations, and the mapping application is an integrated part of a geographic information system (GIS). A GIS is a fluid and dynamic representation of a database of spatial information; in the case of mobile phones, the GIS is integrated into a network of localized cell towers, remote data centers, global positioning system (GPS) satellites, and their United States Air Force control centers. Of the many culturally significant technologies layered in the making of a mobile phone, as well as the complex array of operations necessary for a map application, the database (a key part of any GIS) is of particular interest because of its recent history in art and design, as well as its pervasive application in a technologically oriented society.[1]
In this essay, I argue that the database, as a technology and a cultural object, can provide productive common ground for artists and designers to contribute to a broader dialogue around spatial and temporal representations in maps and mapping. This dialogue is important because, in general, the world-making act of cartographic representation lacks a temporal dimension.[2] Prior to the proliferation of mobile devices, a typical map (e.g. 1:1250 city-scale maps) used an idealized temporal perspective that negates many temporal phenomena, such as ecological rhythms or daily and seasonal cycles, prioritizing that which is perceived as solid and static.[3] However, transforming the objects-based technologies of maps into the distributed technologies of GIS could provide new ground to reimagine the representation of temporal phenomena in maps and mapping. This is because database technologies, which have played a pivotal role in that transformation, have had such widespread application in the twentieth century. While most of this has been oriented toward industrial and commercial optimization, artists and designers have also undertaken significant creative projects both with and about databases to discover and construct their cultural significance. Artist and theorist Lev Manovich first asserted this cultural significance of the database in the 1990s, at the same time that a number of significant database works by artists such as Natalie Bookchin, Chris Marker, Antoni Muntadas and David Rokeby were being produced. Many of these works reconsidered the representation of temporal phenomena, both indirectly and directly, through their engagement with the database as tool and cultural object. Following this early interest in the technology, works in the early 2000s shifted away from the database as a form to a more general interest in data, and temporal phenomena were largely reduced to one type of data among many. My consideration of these works suggests that we, as artists and designers, have only begun to expand on the possibilities of temporal representations that the database offers, but that we must persist in creative engagement with these technologies at a profound level in the hopes of re-assessing the temporal dimensions of cartographic representations.
Time and space come apart
The goal of this essay is to find common ground on which new approaches to the representation of temporal phenomena might be built, and thus make an artistic contribution to the dialogue on how we represent space in maps and cartographic practices. The artistic thinking here is framed by the idea that temporal and spatial representations have become isolated from each other. Although there is a distant and unimaginable past where temporal and spatial phenomena were almost always experienced in unity, in the long now of today they seem fragmented and dispersed. Maps (crafted objects of spatial representation) and cartography (the codified practices of map making) are so deeply embedded in our process of perceiving the world that many consider mapping to be a ‘natural’ human act and maps to be objective documents; but the making of maps necessitates a process of separating spatial representation from temporal.[4] To represent the world, which sublimates temporal qualities of that world.[5] The image of a map most often exists outside of the temporal realm, enabling us to see space from an impossible perspective. While a map image might have a definable historical time, other temporal phenomena are generally erased or amalgamated into a single idealized moment.[6] The fluctuating banks of rivers, the cyclical growth of flora, the accumulation of snow are usually only found on maps designated to represent such things. For most maps, temporal elements simply become something that is not indicated.[7]
While maps and cartography have neglected the temporal dimensions of space, the standardization of clock time has significantly reduced the spatial qualities of temporal phenomena. The measurement and representation of those phenomena were once grounded in an embodied understanding of the relationship between the earth (or one’s place on it) and the sun and other celestial bodies; but advancement in mechanical technology began to separate time from location, pushing it toward a kind of placelessness. In the seventeenth century, timepieces measured tiny mechanical movement with increasing precision, but the position of the sun, as seen from one’s particular place on the earth, remained the method for determining specific local time.[8] but eventually the growth of the railroad (or perhaps, more precisely, railroad companies) created a desire for a single standardized time.[9] Simultaneously, the invention of the telegraph enabled the realization of this desire—eliminating, before long, any variations of now from one place to the next.[10]
Looked at on this scale, it seems that cartographic space and standardized time each became a kind of singularity, pushed away from each other.[11] Together, by the end of the twentieth century, they expanded to capture the entire globe. While this assertion is somewhat simplified, it is not untrue; it is like the image of the world created by a map: when one zooms out, the rough edges of things become smooth and unbelievably elegant.
Maps become geographic information systems
A map was once a fairly discrete and static object. Cartographers crafted maps using stable materials we could hold, and cartographic space was represented and reproduced on the static surface of the paper. However, like so many other things, maps have been fundamentally transformed by the development of digital technology. Cartographic space has been extended and interconnected through an array of technologies. What we call maps are most often GIS’s of one kind or another, and what we hold in our hands is not a map per se but most often a multi-purpose layering of digital and electronic technologies.[12] A GIS, in a general sense, is a digital system for analyzing and representing geographically enabled data: that is, data that is identified with a location. Geographically enabled data exists in a number of forms (e.g., vector and raster images, tables, and databases) and GIS software interprets a variety of data types or file formats for representation in map form. Like many of the most significant technological systems, GIS was generally developed outside of open discourse on its social, political, and aesthetic implications. Only after the most fundamental technical elements were in place did it become possible to examine and reflect on these aspects of GIS.
In the introduction to the SAGE Handbook of GIS and Society—a cross-section of intellectual perspectives on GIS from human geography scholars—the editors describe the development of GIS and the conflict in the 1990s between geographic information scientists and critical human cartographers.[13] The technical–social conflict around GIS was addressed through determined and considered efforts of the US National Center for Geographic Information and Analysis (NCGIA), which developed research programs to foster collaboration and highlight the importance of a more nuanced view of the simplistic polarization of technology and society. One result of these coordinated research initiatives was the edited volume Spatial and Temporal Reasoning in Geographic Information Systems, published in 1998, whose preface described its audience as being
broadly interdisciplinary, bringing together scientists from such areas as geography, cartography, surveying and civil engineering, computer science (primarily databases, artificial intelligence, and user interface), mathematics (primarily logic and topology), environmental and cognitive psychology, cognitive science, linguistics, and such application domains as anthropology, history, archaeology and geology.[14]
It is likely not surprising to anyone that art and design are absent from this list, but we should not feel too excluded given that the ‘application domains’ mentioned from the humanities are designated as users rather than participants in the generation of this spatial and temporal reasoning. There are, no doubt, interesting results from this broadening of the discourse on mapping and cartography; however, discussions on temporal phenomena do not yet feature in this broader discourse in any significant ways.[15] While GIS technology seems to offer new possibilities for temporal representations in cartography, the systems seem to be developing an expanded reach for traditional cartographic representation rather than transforming them in any significant way.
A variety of fundamental components of GIS are shared across many present-day technologies: when it comes to the need for and power of microprocessors, the ability to transmit information over various telecommunication networks, or the image capacity of liquid crystals or light-emitting diodes, the database is at the core of the system. While the organization of data (both recorded from the world or to be implemented on the territory) was always a key aspect of cartographic representation, the making of a map is an attempt to solidify data into a position, or as Dennis Wood suggests, ‘maps are arguments, and […] mapmaking is a rhetorical exercise’.[16] Maps continue to be rhetorical, perhaps more so than ever before relationship between data and the map has significantly changed. The techno-fluidity of our current cartographic representations depends on robust and well-designed databases. The database provides the fundamental structure through which GIS software interface can access, interpret, and create images; but, more importantly, it does this over and over again with every alteration of the parameters of the data, done most often by the user, for example, through zooming out or turning off layers, or through ‘real-time’ generation of data. The map is no longer an expression of complicated social, political, and technological infrastructure made into a physical object. Its physical nature, some combination of software and hardware, is a complicated infrastructure and the database plays a central, critical and constant role. The language of cartography, its symbols and conventions, are displaced in the role that information technology plays in the representation of the world in GIS. This is not to say that the language of cartography is irrelevant or that it should be discarded, but that there is an opportunity to redefine spatial representations when we shift focus to the role of the database and consider that language as part of an array of representational possibilities.
The database as common ground
The story of the database is bound up with the widespread digitization of culture over the last half-century. While systems for organizing information are not new, the development of computer databases (and the foundational mathematical formula allowing innovative access to the data within them) is an under-appreciated technological transformation in recent history.[17] In the twentieth century, investment in these complicated database systems, and the research developments necessary for them, were almost exclusively the domain of major scientific, military and commercial endeavours: for example, the Apollo spacecraft’s navigational system; the American Military’s Global Positioning System (GPS); multinational hoteliers’ need to identify empty rooms; or airlines’ to identify available seats for purchase. Eventually, however, database technology would become central (although largely invisible) in an innumerable variety of everyday technologies.
Databases are obviously not all of the same kind. Beginning with the hierarchical databases of the 1960s, a significant shift occurred in 1970 when IBM researcher E.F. Cobb provided the theoretical foundations of a relational database.[18] The new level of flexibility in accessing (done through a Structured Query Language or SQL) and expanding the data led to the growth of new uses for databases and their management software.[19] Perhaps one of the most notable developments is the founding of Oracle in 1978, which launched the first commercially available SQL system in 1979. Founder Larry Ellison, while lacking the mythology of the likes of Tim Berners-Lee or Steve Jobs, is still the executive chairman of Oracle, now one of the most profitable software companies in the world.[20]
The evolution of the database does not lead us back directly into the field of art and design or the question of temporality in mapping, but it serves as another part of the argument about the possibilities of this relatively new cultural object. In the previous sections, I discussed the ideas and technological processes that split temporal and spatial phenomena in order to advance specific representations of the world. Following the map into its transformation as a GIS brings us to a kind of clearing. While the database is a major force in the technological systems implicated in the representation of cartographic space, the story of the database itself reminds us that it is a force in an array of other technological systems: for example, for corporate accounting; inventory and client management; information modeling; government resource-management; citizen information; law and regulation—and also, in some small part, in the work of artists and designers. In this way, I am suggesting that the database is a kind of clearing, a common space where one can stand and look around to consider what possibilities might be offered on this shared ground.
While artists and designers engaged in mapping and cartography before the emergence of GIS, a significant shift occurred with the emergence of the new technological context. On one end of the spectrum, artist and designers, rather innocently, take up the technologies of cartography as aesthetic curiosities; on the other end, politically charged works attempt to challenge what is or is not represented on the map, but in the end the power imbalance remained very squarely in favour of the scientific and industrial domains. However, it might be possible that the development of GIS, and its underlying technological systems, has offered at least a sliver of opportunity for new space–time representations—and not because of technology’s affordability and accessibility, but rather because the edges are blurring and the boundaries bending. The domains of control over the technologies necessary for cartographic representation and mapping no longer reside solely within those professional communities. That shift in power has been brought about by techno-cultural objects like the database, and it seems important to continue to examine, in as many ways possible, the creative and critical potential of this shift.
Art, design and the cultural object of the database
My specific interest is in new representations of temporal phenomena that are spatial, but with a spatiality that is not dominated by location and static form. In my formal training in architecture, I began to explore alternatives to the traditional mapping and representation of an architectural site in order to consider more ephemeral and intangible qualities of a place. I was increasingly curious about the way in which GIS collected, organized, and represented data and how difficult it was to represent things that fell outside of the frame GIS created. I was certainly not alone in questioning the frame of GIS from an architectural perspective; however, it seemed that much of the discourse around technology and representation (in my architectural circle) did not include the voice and work of artists who had been critically engaging with technology and representation for decades.[21] Where many other domains of culture passed through the common ground of the database with an instrumental eye on things beyond the database itself, some artists and designers lingered and immersed themselves in the tension between the functional potential of the technology, the complexity of their construction, and the impact of digitizing the world.
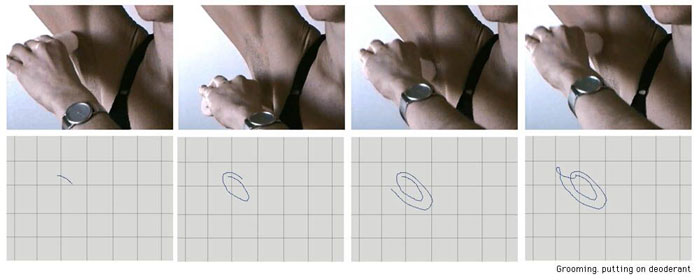
Natalie Bookchin, Databank of the Everyday, 1996. Image courtesy of the artist.
Beginning in the 1980s, as digital technologies began to overtake twentieth-century electronics, a new generation of artists explored code, data and algorithms with increasing depth and diversity.[22] David Rokeby’s The Giver of Names (1991– ), for instance, is an interactive work for interpreting objects presented to it, centered on a learning and evolving database built by the author. As well as engaging with the database form as an avenue to explore the poetic dimensions of perception and interpretation, Rokeby built the central piece through a patchwork of research on other language databases.[23] In 1994, Antoni Muntadas’ The File Room began simultaneously as an installation at the Randolph Street Gallery in Chicago and as a site accessible over the internet (where it continues to exist at http://www.thefileroom.org). The project centered on the construction of a database cataloguing artistic censorship from the around the world, creating a tension between the sinister possibilities and collaborative potential of the database. Natalie Bookchin’s Databank of the Everyday (1996) structured an overwhelming volume of the banal details of daily routines of the body into a CD-ROM form. By engaging database technology, Bookchin’s work experiments with its potential to represent the body and its cyclical temporal dimension. Another significant CD-ROM project) came from Chris Marker: his Immemory (1998) is a self-reflective exploration of memory through the non-linear form inherent to the database. In the realm of art engaged with technology, the database figured strongly as a both an artistic concept and a critical term around this period.
In 1997, artist, data scientist and media theorist Lev Manovich presented his argument for the database as a genre of new media and an important cultural form through a juxtaposition against the concept of narrative.[24] We can perhaps read this text as a pivotal point in the cultural relationship to the form of the database. Manovich articulated many key elements of the database—non-linearity, restructurability, and responsiveness—which, although more commonplace to us now, had not entirely entered the cultural lexicon nor been demonstrated at work in technology, media, and art objects. More than crystalizing elements, or perhaps in order to crystalize the database as a cultural object, he argued the contrast between narrative and database to a particular extreme:
As a cultural form, database represents the world as a list of items and it refuses to order this list. In contrast, a narrative creates a cause-and-effect trajectory of seemingly unordered items (events). Therefore, database and narrative are natural enemies. Competing for the same territory of human culture, each claims an exclusive right to make meaning out of the world.[25]
Manovich is overstating the case, but the importance of his argument, to both the work that came before and the work influenced by his ideas, is his assertion that the database has a critical role in ‘making meaning’. If he doesn’t argue for it as a medium in and of itself, he at least positions it as a key component of emerging media in the digital age.
Manovich contrasts the emergent cultural form of the database against what he characterizes as the dominant cultural form of the narrative. While Manovich does not discuss time specifically, the underlying theme is a significant transformation for time-based media. The singular unfolding nature of analogue media was shifting and expanding into a fluid and non-linear structure that was not only possible but inherent to new technologies, and this opened up new possibilities for temporal representations.[26] Manovich mentions Chris Marker’s Immemory as an excellent example of an artist exploring the database as a cultural form.[27] The project considered the past and memory, and rather than presenting the story of his life, Marker consciously attempted to provide a new temporal representation of memory. In the notes for the project, Marker wrote, ‘My idea was to immerse myself in this maelstrom of images to establish its Geography’.[28] The spatial metaphor of Marker’s notes was promising, but the project—and many others that followed in the genre of interactive narratives—were not very rich in their actual spatial dimensions. While this arc of the interactive narrative continued to develop, it became somewhat more connected to the history of contemporary gaming rather than mapping or technology-based art. In the development of gaming technologies and experiences (within which I will place interactive narratives), the database allowed a story or game to contain a range of elements accessed in different ways by the player. This has developed into an incredibly sophisticated level in contemporary gaming, but the relationship to time, in a very general sense, seems focused on the manipulation of linear time (starting over, speeding up, going backwards, stopping time) and not directly concerned with different representations of temporal things.[29] Although game designers have developed complex elements to enrich the players’ experience, much of this complexity has been focused on modelling ‘realistic’ elements of the material world, and a side effect of this is the temporal texture of the game world. For instance, in the expansive open play worlds developed by RockStar Games, such as the Grand Theft Auto series (1997–2013) and Red Dead Redemption (2010), the player’s movement through the game is affected by different types of cyclical elements, including daily, seasonal, weather, and other temporal models. Following a thread of ideas about temporality and gaming is a path that leads far away from this essay, but it does demonstrate the size and significance of the common ground of the database.
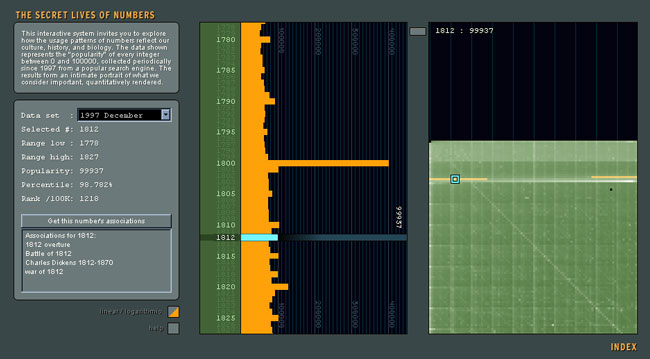
Golan Levin et. al., The Secret Life of Numbers, 2002. Image courtesy of the artist.
The argument for the cultural importance of the database in the art world has been evident in curated shows such as Database Imaginary co-curated by Sarah Cook, Steve Dietz and Anthony Kiendl, but the database seems to have been overtaken by other overlapping concepts as we have seen a broad shift in interest from the infrastructure or frame to the content. The database (infrastructure) becomes less visible and new terms like datasets, big data, or just data (content) take more significant places, particularly as we see the expansion of the art and design field of digital information visualization through the early 2000s. Many of the most significant works from this period, existing between art and design, concern the representation of massive quantities of information in various ways. Some simply explore the aesthetics of organized data, for instance, Aaron Koblin’s Flight Patterns (2005–09), while others instrumentalize aesthetics as a method for understanding the complexity of large amounts of data, for instance, Ben Fry’s Genome Valence (2001), exploring data about the human genome. Perhaps a fitting combination of the two themes is Golan Levin’s The Secret Lives of Numbers from 2002, which is, in essence, a project on gathering massive amounts of data about numbers themselves.[30]
Many of these types of projects are seduced by the fluid nature of digitized information working to structure and restructure relationships, and time is mostly treated as simply another form of data. This has led to some interesting temporal representations, but it seems difficult to find more profound questioning of temporality itself. Ben Fry’s The Preservation of Favoured Traces (2009) explores the iterative nature of Charles Darwin’s Origin of the Species. The entire text is presented as an evolving palimpsest that can be manipulated at different physical and temporal scales, from the entirety of the text to the details of the evolving passages; but here time is perhaps just another scale to be manipulated. A more recent work by Rafael Lozano-Hemmer, Zero Noon (2013), also captures this approach to time as simply-another-form-of-data. It is an interactive digital clock that expresses time in a variety of statistical forms, such as guns sold, the global population, or Google website visits. In one sense, it can be read as a way to reconnect temporal experience to data, which is more often represented as an independent and infinitely manipulable aesthetic object. The running clock constantly increases the value you selected to have time represented as—for instance, number of guns sold—giving a living dimension to the data, but also a powerlessness against its infinite increase. However, beyond this perpetual forward motion, the piece doesn’t bring back any temporal texture to the data. The information was stripped of its temporal quality in the process of becoming a statistic. It has been rendered into a mass (a dataset or table in a database) and then divided by the standard for measuring and representing temporality with clock-time, and in a similar way to The Preservation of Favoured Traces, and many other works, the representation does not overcome the place of clock-time as the dominant scale to measure the temporality of the world.
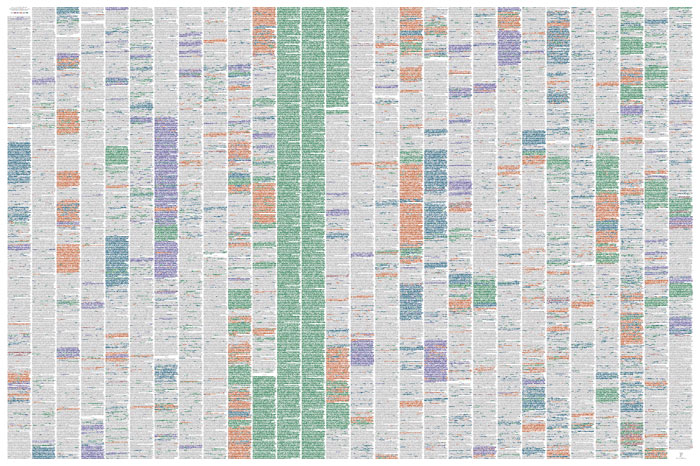
Ben Fry, The Preservation of Favoured Traces, 2009. Image courtesy of the artist.
Conclusion
Above I suggested that artists and designers were discovering potential for the database to support new temporal representations; however, following art and design’s relationship to the database, through a number of representative examples, I find that temporality has most often been accepted simply as clock-time in database projects. This is understandable given the inextricable depth to which clock-time is woven into the fabric of our world, and it is certainly not a critical weakness in the works discussed. They nonetheless offer hope for the potential of the digital technology involved in organizing and storing data to provide creative leverage for a broader range of temporal representations; but this requires continued experimentation and interrogation of the infrastructure and of the systems we use. The challenge to overcoming the dominance of cartographic representation of space is similar to the challenge of overcoming clock-time. They are both fundamental building blocks for communication and commerce in the twenty-first century, and it would be folly to pursue other representations as a means to usurp or undermine their legitimacy. However, despite the significant place of these representational models, we must continue our investigation into the fundamental aspects of our representational methods in both the sciences and the humanities, as it is through this that we will be able to expand our understanding of the world, developing and sharing new and different types of knowledge.
While I have not discovered significant expansions of the representational approaches of spatio-temporal phenomena in the untethered and fluid explorations of the digitized matter of the world, I would like to draw into the conclusion a set of maps created within a scientific frame. The Worldmapper project presents a series of world maps where different statistical variables affect the size of the countries represented.[31] Although a simple and obvious technique for visualizing information, the approach has an interesting representational result. Rather than simply scaling everything about a country up or down depending on the statistical value, and disassociating the countries from the land masses and from each other, countries remain connected together at the borders resulting in a ‘distorted’ view, where countries are inflated or shrunk or squishing or squished. This approach is perhaps most successful because it is done at the scale of the planet and the deviations feel forgivable. By allowing the information about the political entities to alter the ‘correct’ representation of the globe, the maps produced by Worldmapper project suggest other spatial representations beyond the cartographic. The collection ‘distorts’ the world’s representation through a variety of lenses that together suggest or reveal how their manipulation of the spatial qualities of the globe, far from eroding any truth about its standard or correct cartographic representation, reveals important realities about it.
What I find interesting about the representational results of the Worldmapper project is their aesthetic relationship to the Surrealist Map of the World from 1929. Where the Surrealist map created deliberate distortions of the global terrain to represent a different political view of the world, the Worldmapper project puts the distortions in the hands of a custom algorithm that represents global statistical databases as world maps. Both approaches have an embedded politics, but this is inserted into the representations in different ways. The political and aesthetic proximity of these two representations (but also their methodological distance) is an important set of examples in the imagined conversation I suggested at the outset of this essay. The Worldmapper project points to the cartographic space as an important representational approach that should not be abandoned. However, if we suspend cartography’s license for the exclusive role of representing the territory, new realities of the territory can be revealed. It would, of course, be a utopian projection to imagine artists and designers invited to the table in the equal partnership of developing spatial, and particularly spatio-temporal, representations. But if we can begin to imagine the acknowledgment that cartographic representations (and clock time) do have any exclusive and ultimate claim to reality, then perhaps we will slowly craft new representations that can be shared across disparate domains of culture. I have attempted to make a small contribution to a necessary dialogue that could connect geography, cartography, art, and design through some of their underlying technological infrastructure. While I have approached the examples and connections suggested with a critical edge, it is not to cultivate a resistance to the particular technologies, but to highlight a blind spot that may be important to turn toward.
[1] I use design in this essay as a high-level term that includes an ever-increasing variety of design practices; in particular I do not see architects as something separate, but as another group of practitioners doing design work.
[2] This understanding of representation is significantly influenced by phenomenological interpretations of the concept proposed by architectural scholar, Dalibor Vesely. For Vesely, ‘representation more or less coincides with the essential nature of making, and in particular with the making of our world’ (Architecture in the Age of Divided Representation: The Question of Creativity in the Shadow of Production [MIT Press, 2004], 13). In the specific discussion of maps and representation in this essay, geographer Denis Wood comes to a fairly similar conclusion through a different intellectual framework, asserting that ‘far from being pictures of the world maps are instruments for its creation; that is, they are not representations but systems of propositions, arguments about what the world might be’ (Wood, Denis. Rethinking the Power of Maps [Guilford Press, 2010], 8).
[3] I must acknowledge the role my friend and mentor Federica Goffi has played and continues to play in broadening my understanding of time, architecture and the city. Essential ideas can be found in her book Time Matter(s): Invention and Re-Imagination in Built Conservation: The Unfinished Drawing and Building of St. Peter’s, the Vatican (Ashgate Publishing Ltd, 2013).
[4] While there continues to be a dominant belief that cartography is an act of accurately recording the physical world, a significant reassessment of the social, cultural and historical nature of maps, map-making, and the modern practices of cartography began in the late twentieth century. Brian Harley played a significantly role in this intellectual effort with his influential essay, ‘Deconstructing the Map’, Cartographica, 26:2, 1989, 1–20, where he argues against the pervasive objectivist scientific framework embraced by cartography, and to both understand and dismantle the power relations embedded in and produced by maps. The understanding of the map and cartography in this essay is influenced by Harley’s intellectual legacy, particularly through the work of Denis Wood.
[5] The foundational practices of cartography have not shifted significantly away from a focus on location as defining principal of maps, but there are important developments in the understanding of cartographic representation of temporality and spatiality. Geographer Doreen Massey offers a consideration of the tension and opportunities existing between different understandings of these concepts in ‘Space-Time, “Science” and the Relationship between Physical Geography and Human Geography,’ Transactions of the Institute of British Geographers, 24:3, n.d., 261–76.
[6] To say that maps have a historical time is to say that maps may typically acknowledge their place in a linear notion of modern calendar time. As Denis Wood describes, ‘Somehow we’ve gotten the idea that maps have nothing to do with time. We’ll indicate a date of publication, and perhaps a time frame for data collection, but that’s about as far as it goes; and these gestures have more to do with the status of the map as a document than with any issue of map time’. Wood, 2010, 94.
[7] Terry Atkinson and Michael Baldwin’s Map to Not Indicate from 1967 grapples with the essential tension in map making of what is and is not represented on the map. Their map contains the political boundaries of two US states, alone like islands on the framed blank page. Outside the largely blank frame is an extensive list of what is not indicated on the map.
[8] ‘Railway Time,’ Greenwich Mean Time, 1995, https://greenwichmeantime.com/info/railway/.
[9] An important artistic diversion on the difficult task of achieving this desire is found in Coincidence Engines from Montreal duo [The User]. Inspired by the metronome work of György Ligeti, Coincidence Engine One: Universal People’s Republic of Time is an amphitheatre for one that surrounds you with 1200 identical personal clocks. The ticking clocks creating an oceanic feel with minute discrepancies of measure washing over you. See: Canty, Daniel, and [The User], eds, [The User]: Instruments 1997-2008 (Berlin–Montreal: Künstlerhaus Bethanien GmbH–Productions indéfinies, 2014).
[10] While many site-specific artworks attempt to ground both space and time in a specific place, the most ambitious of these attempts is likely James Turrell’s (as yet completely realized) Roden Crater. Turrell’s project attempts to reunite the embodied experience of space and time. Turrell’s transformation of the volcanic cinder cone in the Arizona desert does not seem concerned directly with cartography; nonetheless, his attempt to produce images and experiences of celestial events, and our place in relation to them, could be one of the most important and beautiful maps of space and time ever produced.
[11] From both a scientific and a philosophical perspective, Einstein’s special theory of relativity and his suggestion of the concept of space-time is a pivotal point in the process of reconnecting our conceptions of space and time. This begins at the dawn of the twentieth century, but this narrative is following these two cultural entities that are formed prior to Einstein’s theoretical findings.
[12] Imagine for instance one of the most complicated but increasingly ubiquitous components of this infrastructure. Global Navigation Satellite Systems (GNSS), which include the US Military owned and operated GPS and the Russian GLONASS, will soon include over one hundred satellites orbiting the earth. It is difficult to comprehend the complicated infrastructure required to develop, construct, launch, operate and maintain these immense locative systems. See ‘Global Navigation Satellite Systems (GNSS),’ United Nations Office for Outer Space Affairs, http://www.unoosa.org/oosa/en/ourwork/psa/gnss/gnss.html, accessed 14 June 2017.
[13] Nyerges, Timothy L., Helen Couclelis, and Robert Brainerd McMaster, eds, The SAGE Handbook of GIS and Society (Los Angeles: Sage, 2011), 4.
[14] Egenhofer, Max J., and Reginald G. Golledge, Spatial and Temporal Reasoning in Geographic Information Systems, Spatial Information Systems (New York: Oxford University Press, 1998), v.
[15] For instance, anecdotally, the index of the Sage Handbook of GIS and Society (Ibid) indicates only two entries on time in its 550 pages and those are contained to an essay on ‘Time Geography’ (essentially adding a Z axis for time on cartographic representations) as a method for studying human activity.
[17] For instance, Paul E. Cerruzzi’s A History of Modern Computing (MIT Press, 2003) does not mention Cobb and has little mention of relational databases.
[18] IBM, ‘Edgar F. Codd,’ IBM Archives, https://www-03.ibm.com/ibm/history/exhibits/builders/builders_codd.html, accessed 31 May 2017.
[19] Cobb was given the A. M. Turing Award for contributions to computing. His contribution is described by the Association for Computer Machinery as ‘one of the great technical achievements of the 20th century.’ See, ‘Edgar F. Codd – A.M. Turing Award Winner,” A.M. Turing Award, http://amturing.acm.org/award_winners/codd_1000892.cfm, accessed 7 June 2017.
[20] ‘The World’s Biggest Public Companies,’ Forbes, https://www.forbes.com/companies/oracle/, accessed 7 June 2017.
[21] Architects and architectural scholars have a very long history discussing the relationship between technology and architecture, and the importance of digital technologies in architecture in the late twentieth century cannot be understated. However, a considerable amount of this discourse and the design embedded within it is either about form-making or maximizing efficiency. There is some considered discourse around the meaning and transformation of the digital as a representational tool, but it is often dominated by a rather uninteresting and superficial opposition between hand drawing and digital drawing. Beyond this, when architectural scholars, such the phenomenological lineage that extends from Dalibor Vesely and Joseph Rykwert, are more deeply engaged with the work of artists, they tend to examine up to and including modern European and North American movements rather than exploring the work of artists entangled in the technological developments of the late twentieth and the early twenty-first centuries.
[22] The previous exceptional development of artists engaged with code comes in the 1960s and 1970s; however, this was a much more limited environment given the difficulty of accessing computing technology. Grant D. Taylor documents the earlier experiments with art and code from the 1960s and 1970s in his book When the Machine Made Art: The Troubled History of Computer Art (Bloomsbury Publishing, 2014).
[23] ‘Interview with David Rokeby: Question 20 Authoring of the Software (Vocabulary Database)’, The Giver of Names: Documentary Collection, 2008, http://www.fondation-langlois.org/html/e/page.php?NumPage=2130, accessed 4 September 2017.
[24] Manovich, Lev. ‘Database as a Genre of New Media’, AI & Society, 14:2, 2000, 176–83.
[26] Manovich writes extensively about how many ‘new media’ art works executed as some form of narrative for the experience of the audience is nonetheless driven by a database underneath. The narrative structure is laid on top, and Manovich finishes the original essay with this somewhat surprising question, ‘More precisely, a database can support narrative, but there is nothing in the logic of the medium itself which would foster its generation. It is not surprising, then, that databases occupy a significant, if not the largest, territory of the new media landscape. What is more surprising is why the other end of the spectrum—narratives—still exist in new media.’ Ibid., 183.
[27] As an interesting note on time and technology, I am no longer able to play my personal copy of Immemory as most current technology has ceased to support many of the elements needed to play the CD-ROM, making the project itself a kind of faded fragmented memory.
[28] Marker, Chris. ‘Immemory Liner Notes,’ Chris Marker, 1997, https://chrismarker.org/chris-marker/immemory-by-chris-marker/.
[29] With the increasing depth in the cultural form of the game there have, no doubt, been interesting engagements with temporality, but the tendency described here is a significant, if not dominant, structuring approach in game design.
[30] It is worth noting in this consideration of time and representation that this piece has also been rendered somewhat obsolete by the constant changing technological infrastructure and is no longer available in its full online form.
[31] Dorling, Danny, et al., Worldmapper, http://www.worldmapper.org/index.html, accessed 12 June 2017.
Ryan Stec is an artist, producer and designer working in both research and production. Beginning his relationship to the moving image through documentary, his practice has slowly expanded off the edges of the screen, increasingly combining light, color, structure and material with deeper consideration of site and the city. Stec is a PhD candidate at the Azrieli School of Architecture and Urbanism, Carleton University. His research is focused on temporary and informal interventions in the city, and the exploration of new approaches to mapping temporal phenomena. He has also been heavily involved in the artist-run culture of Ottawa, Canada since 1998, and since 2005 he has been the Artistic Director of Artengine, a non-profit center for art and technology. In his role at Artengine, he has developed an interdisciplinary and collaborative approach to project production that includes festivals, symposia, workshops, interactive public art, commissions for non-traditional venues and innovative models for service delivery and knowledge sharing.